


We continuously monitor and evaluate our environmental footprint and implement innovative solutions to establish sustainable and low-carbon operations.
Energy and Emission Management
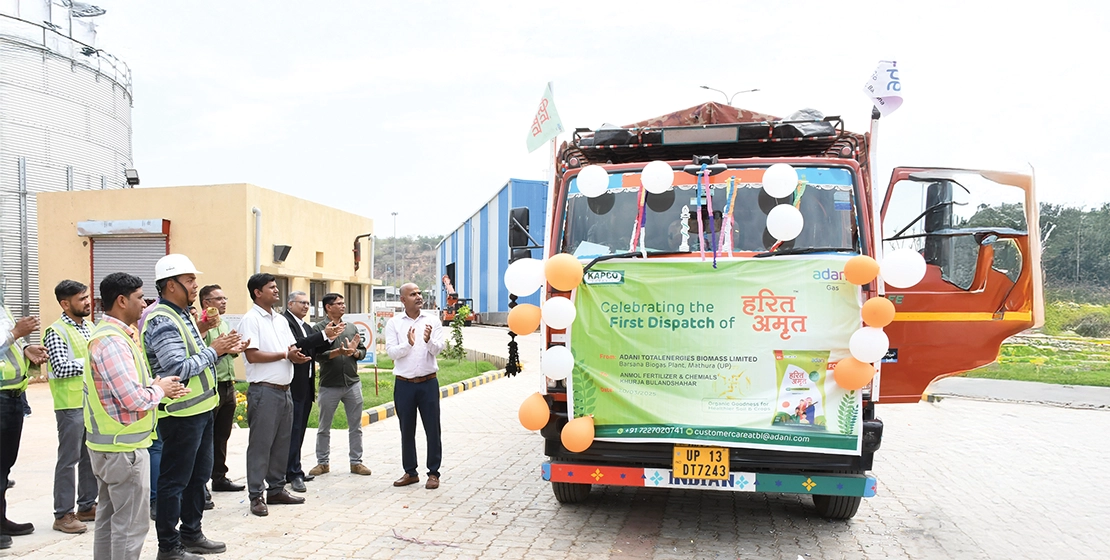
First Despatch of Organic Fertiliser under 'Harit Amrit' Brand from Barsana Plant, Uttar Pradesh
Approach
Our Board-approved Climate Change Policy and Energy Management Policy guide our strategies and operations to optimise our energy use and reduce emissions through renewables, innovative technology, and low-carbon alternatives. We conducted energy conservation audits for sites, including CNG stations, City Gate Stations and offices.
These audits have helped us implement innovative energy-efficient solutions such as installation of occupancy sensors, energy-efficient fans, and energy-saving air conditioners. While the precise quantification of the impact is difficult due to the complexity of energy optimisation, the implementation of these measures has undoubtedly enhanced the efficiency of our natural gas and electricity consumption.
CASE STUDY
IGBC Gold Certified Corporate Office at Inspire Business Park
Background
The IGBC Gold certification for our Corporate Office at Inspire Business Park shines as a key milestone in our sustainability journey. The corporate office is designed with cutting-edge technologies and eco-friendly materials, optimising resource efficiency. The building's energy management system is optimised to reduce consumption and enhance operational efficiency, while the advanced water management system supports conservation and recycling. Additionally, the waste management protocols in place ensure minimal environmental impact through effective segregation, recycling, and disposal methods.
Impact
Score of 70 GOLD rating
32%
Enhanced water saving potential
100%
Wastewater & wet waste recycling
23%
Enhanced energy efficiency
6.3%
Renewable power consumption
Way Forward
The IGBC Certification – Gold rating is a blueprint for future projects, with plans to extend it across all our CNG stations. By implementing these green building standards, we aim to create a network of sustainable and energy-efficient facilities that contribute to our overall environmental goals.
3%
Reduction in energy intensity from FY 2023-24
1,25,862
MtCO2e emissions (Scope 1 & 2) during the year

946 MtCO2e from 2021-22 baseline
Energy Performance in FY 2024-25
Energy consumption during operations includes electricity from the grid and fuel used in the compressors at Gas dispensing facilities. There was no consumption of fuel from renewable sources.


Note: The above figures are for energy consumption at our EV charging stations.
Reduction in Energy Consumption in FY 2024-25
Amount of energy savings due toconservation and efficiency initiatives - LDAR (in GJ)
6,761
Types of energy included in the reductions; whether fuel,electricity, heating, cooling, steam, or all
Fuel
Basis for calculating reductions in energy consumption, suchas base year or baseline, including the rationale for choosing it
Y-o-Y
Standards, methodologies, assumptions, and/or calculationtools used
Based on saving in gas of fugitive emission through LDAR.
Emissions Performance in FY 2024-25
All GHG emissions are reported in CO2 equivalents. ATGL sources its grid electricity directly from the local grid. ATGL’s Scope 2 emissions are reported solely using the location-based method, representing emissions from the local grid electricity used.
We use renewable energy generated by the captive rooftop solar panel installed across our sites to power our operations which effectively offsets our Scope 2 emissions. Total location-based emissions, were at approximately 45,200 metric tonnes of CO2e in the reporting year.
Methane leaks are the primary source of our Scope 1 emissions. Our Advanced Leak Detection System has significantly improved quantification and reporting of methane leaks, which was earlier done using assumption-based reporting. Methane leaks account for 0.16% of the total gas sold during the reporting period.


Value Chain Emissions Across Scope 3 Categories
98.40% of our value chain emissions are from ‘use of sold products’ category which was 98.76% in the last reporting year. We currently report our value chain emissions across the following Scope 3 categories:


Note: The other Scope 3 categories are not applicable for ATGL business and hence are not reported in the table above.
Ozone-Depleting Substances (ODS) and Other Air Emissions in FY 2024-25
Our heating, ventilation, and air conditioning (HVAC) systems have historically utilised refrigerants such as R22, R134, R407C, and R410, essential for our business operations. Recognising the environmental impact, we have transitioned to refrigerants with minimal Ozone Depleting Potential (ODP) and Global Warming Potential (GWP). This shift aligns with our commitment to sustainability and reducing our carbon footprint. We are currently in the process of mapping emissions under this category to ensure accurate reporting and continuous improvement in our environmental performance.

NOx emissions are estimated from the emissions generated through fuel combustion of fleets (HCVs) & AEO Vehicles